(0.65 % of valid scene pixels)
(4,544 × 3.4 m² per pixel)
(natural spectral-angle break)
547–903 nm (2 bad bands masked)
1. Introduction
Mountain Pass, California is the largest and highest-grade Rare Earth Element (REE) deposit in North America, and one of the most significant globally. The deposit is hosted within a Precambrian (~1.4 Ga) carbonatite intrusion that pierces Proterozoic gneisses and schists of the Clark Mountain Range. The dominant ore mineral is Bastnaesite [(Ce,La,Nd)FCO₃], a fluoro-carbonate that can carry 60–70% REE by oxide weight and is the world's primary source of light rare earth elements (LREE), including cerium, lanthanum, and neodymium.
This study applies hyperspectral remote sensing using AVIRIS-NG VNIR imagery (547–903 nm, 72 spectral channels) and the Spectral Angle Mapper (SAM) classifier to map Bastnaesite-bearing surface exposures. The ENVI software platform with custom IDL scripting was used for all processing steps. The workflow covers:
- Pre-processing and bad-band masking of the AVIRIS-NG reflectance cube
- SAM classification against a resampled Bastnaesite spectral library
- Rule-image thresholding to refine the classification
- Raster color-slice analysis to visualize spectral-angle distributions
- Classification statistics and geological interpretation
2. Dataset & Study Area
AVIRIS-NG Hyperspectral Image
- File: MountainPass_AVIRIS_sub.dat
- Sensor: AVIRIS-NG (Airborne Visible/Infrared Imaging Spectrometer — Next Generation)
- Spatial dimensions: 959 cols × 1,072 rows
- Spectral range: 547–903 nm (VNIR)
- Bands: 72 total (2 bad bands flagged)
- Pixel size: 3.4 m × 3.4 m
- Data type: UInt16, reflectance × 10,000
- Projection: UTM Zone 11N, WGS-84
- Atmospheric correction: QUAC (Quick Atmospheric Correction)
- Bad bands: Bands 43 & 44 (762.39 nm & 767.40 nm) — O₂-A absorption
- Data ignore value: 0 (no-data outside swath)
Spectral Library
- File: bastnaesite_ree_resampled.sli
- Spectrum: Bastnaesite (Ce,La,Nd)FCO₃
- Source: USGS Spectral Library, resampled to AVIRIS-NG wavelengths
- Bands: 70 (bad bands 762 & 767 nm excluded)
- Scale factor: 1.0 (values × 10,000)
Mask File
- File: MountainPass_mask.dat
- Type: Binary byte raster (co-registered with image)
- Values: 1 = valid image pixel; 0 = no-data / NaN region
- Masked pixels: 326,642 (31.8% of image)
- Valid pixels: 701,406 (68.2% of image)
3. Classifier Selection
Several ENVI classifiers are suitable for hyperspectral mineral mapping. The principal options considered were:
| Classifier | Type | Strengths for REE Mapping | Limitations | Suitability |
|---|---|---|---|---|
| SAM (Spectral Angle Mapper) | Physics-based, unsupervised spectral matching | Illumination-invariant; uses full spectrum shape; outputs quantitative rule image; minimal training data needed (1 library spectrum sufficient) | Insensitive to albedo differences; large angles in mixed pixels | ✅ Best choice |
| Matched Filter | Partial unmixing, sub-pixel | Detects sub-pixel abundances; good for sparse targets | Sensitive to background statistics; assumes Gaussian distribution | ✅ Good alternative |
| SID (Spectral Information Divergence) | Information-theory-based | Sensitive to subtle spectral differences; pairs well with SAM | Computationally intensive; less intuitive threshold | 🔶 Complementary |
| Linear Spectral Unmixing | Sub-pixel abundance estimation | Produces fractional abundance maps; ideal for spatially mixed minerals | Requires a complete endmember set; collinearity issues | 🔶 Supplementary use |
| Maximum Likelihood | Parametric, supervised | Familiar to geologists; statistically rigorous | Requires large training set; assumes Gaussian per-class distributions | ❌ Not optimal (no training labels) |
| Random Forest / SVM | Machine learning, supervised | High accuracy with sufficient training data | Needs field-verified training labels; black-box; overfits small classes | ❌ Not applicable (no labeled data) |
SAM is the optimal choice because (1) it requires only a single reference spectrum from the spectral library — no field training labels needed; (2) it is insensitive to illumination variation from the open-pit mine geometry; (3) it outputs a continuous rule image (spectral angle in radians) enabling quantitative post-classification thresholding; and (4) it is the industry-standard algorithm for hyperspectral mineral mapping and directly supported by ENVI with full spectral library integration.
4. Methodology
4.1 Bad Band Handling
The AVIRIS-NG image contains 72 spectral bands but bands 43 (762.39 nm) and 44 (767.40 nm)
fall within the atmospheric O₂-A absorption window and carry unreliable radiance values.
These bands are flagged in the image header (bbl = [..., 0, 0, ...]).
The spectral library was pre-resampled to 70 bands (excluding these bad bands).
For the SAM tool, a 72-element mean array was constructed by inserting 0.0 at positions
43 and 44, with the 70 library values filling the remaining slots. ENVI's SAM algorithm
automatically excludes bad-band positions from the spectral angle computation.
4.2 SAM Classification
The SpectralAngleMapperClassification ENVI task was run with the following configuration:
- Input raster: MountainPass_AVIRIS_sub.dat (72 bands, VNIR)
- Spectra mean array: 72-element float array (Bastnaesite library + 0.0 at bad bands)
- Class names: Bastnaesite
- Threshold: π/2 rad (broad; all pixels classified initially)
- Output rule raster: SAM_rule_raster.dat (per-pixel spectral angle)
- Output classification: SAM_classification_broad.dat
4.3 Rule Image Analysis & Threshold Selection
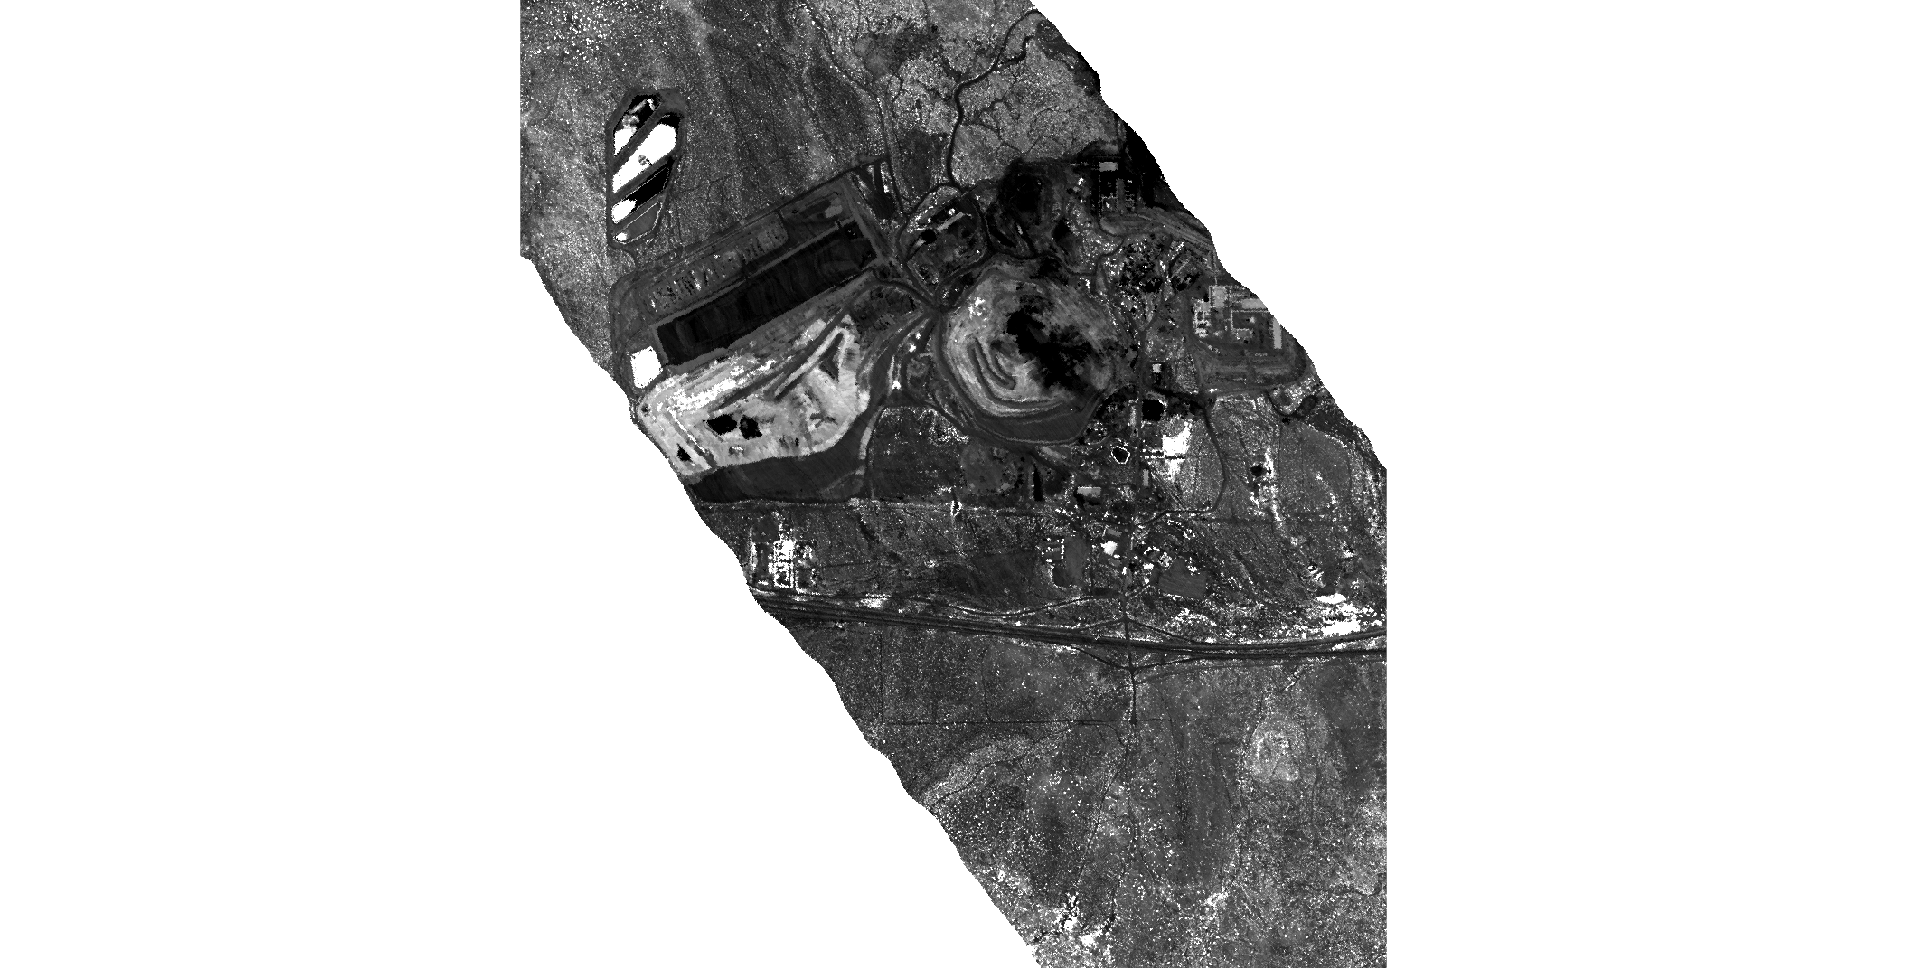
The SAM rule raster was analysed to identify the distribution of spectral angles. Key findings:
- Minimum angle across valid pixels: 0.402 rad (~23°)
- Maximum angle: 0.798 rad (~46°)
- Mean angle: ≈ 0.479 rad
- A natural break was identified at 0.46 rad: pixel counts jump from ~2,938 to ~36,493 in consecutive 0.01 rad histogram bins — indicating a distinct spectral population boundary.
4.4 Classification Refinement — RuleRasterClassification
The RuleRasterClassification ENVI task was applied to the SAM rule raster with:
- minimum_rule = true (pixels with angle < threshold → Bastnaesite; angle ≥ threshold → Unclassified)
- Threshold: 0.46 rad (natural spectral-angle break)
- Result: 4,544 Bastnaesite pixels; 696,862 Unclassified
4.5 Mask Integration
The binary mask file (MountainPass_mask.dat, value 0 = no-data) was applied to assign
all no-data pixels to the dedicated class Masked Pixels (326,642 pixels),
producing the three-class final classification raster SAM_classification_final.dat.
The HDR was written manually to ensure correct ENVI Classification metadata (file type,
class lookup, class names, and UTM map info).
4.6 Raster Color Slice
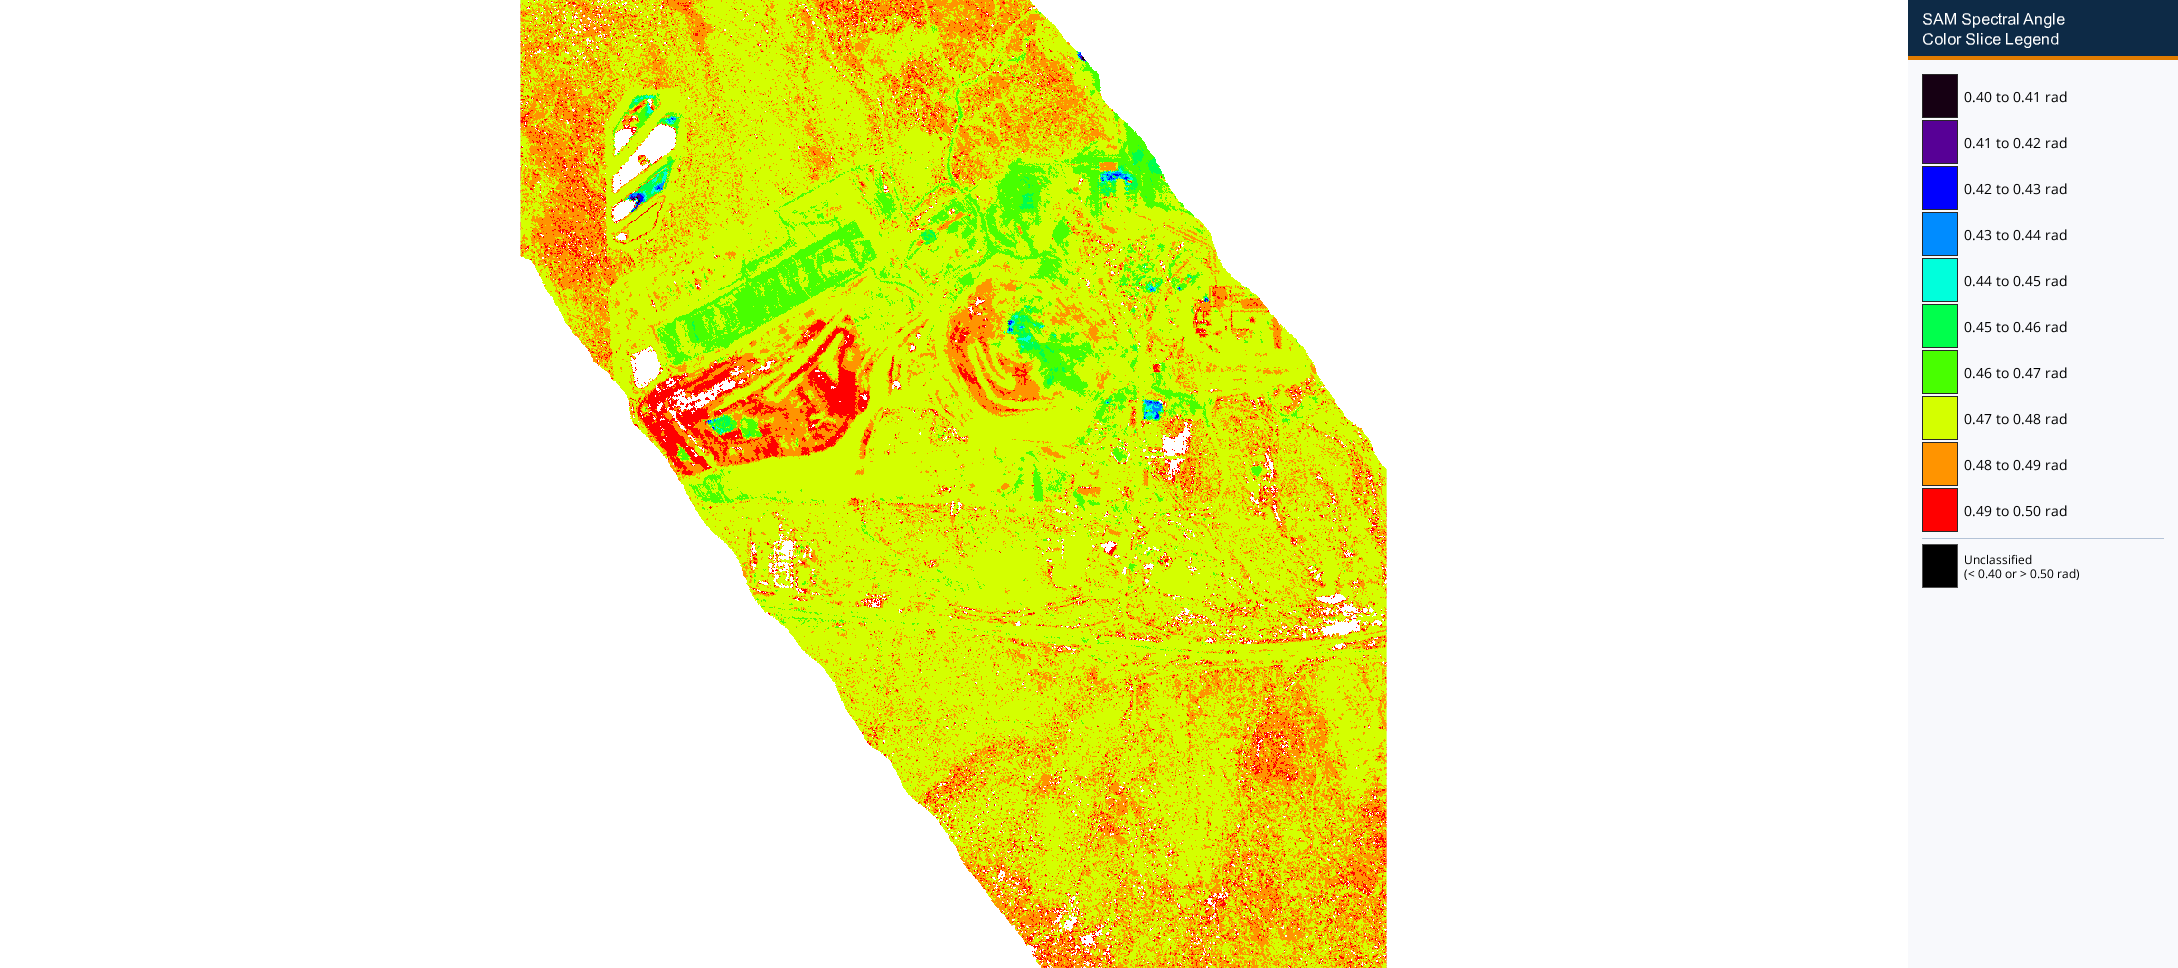
To visualize the continuous distribution of spectral angles, the ColorSliceClassification ENVI task was run on the SAM rule raster:
- Number of ranges: 10 intervals
- Range size: 0.01 rad per interval
- Starting angle: 0.40 rad
- Ending angle: 0.50 rad
- Color table: Full IDL Rainbow (dark violet = 0.40 rad → purple → blue → cyan → green → yellow → orange → red = 0.50 rad); 10 explicit RGB colors sampled evenly from Rainbow table indices 5–255; black = pixels outside the range
- Output: SAM_rule_colorslice2.dat
5. Results
5.1 Scene Overview — CIR Composite & Final Classification Map
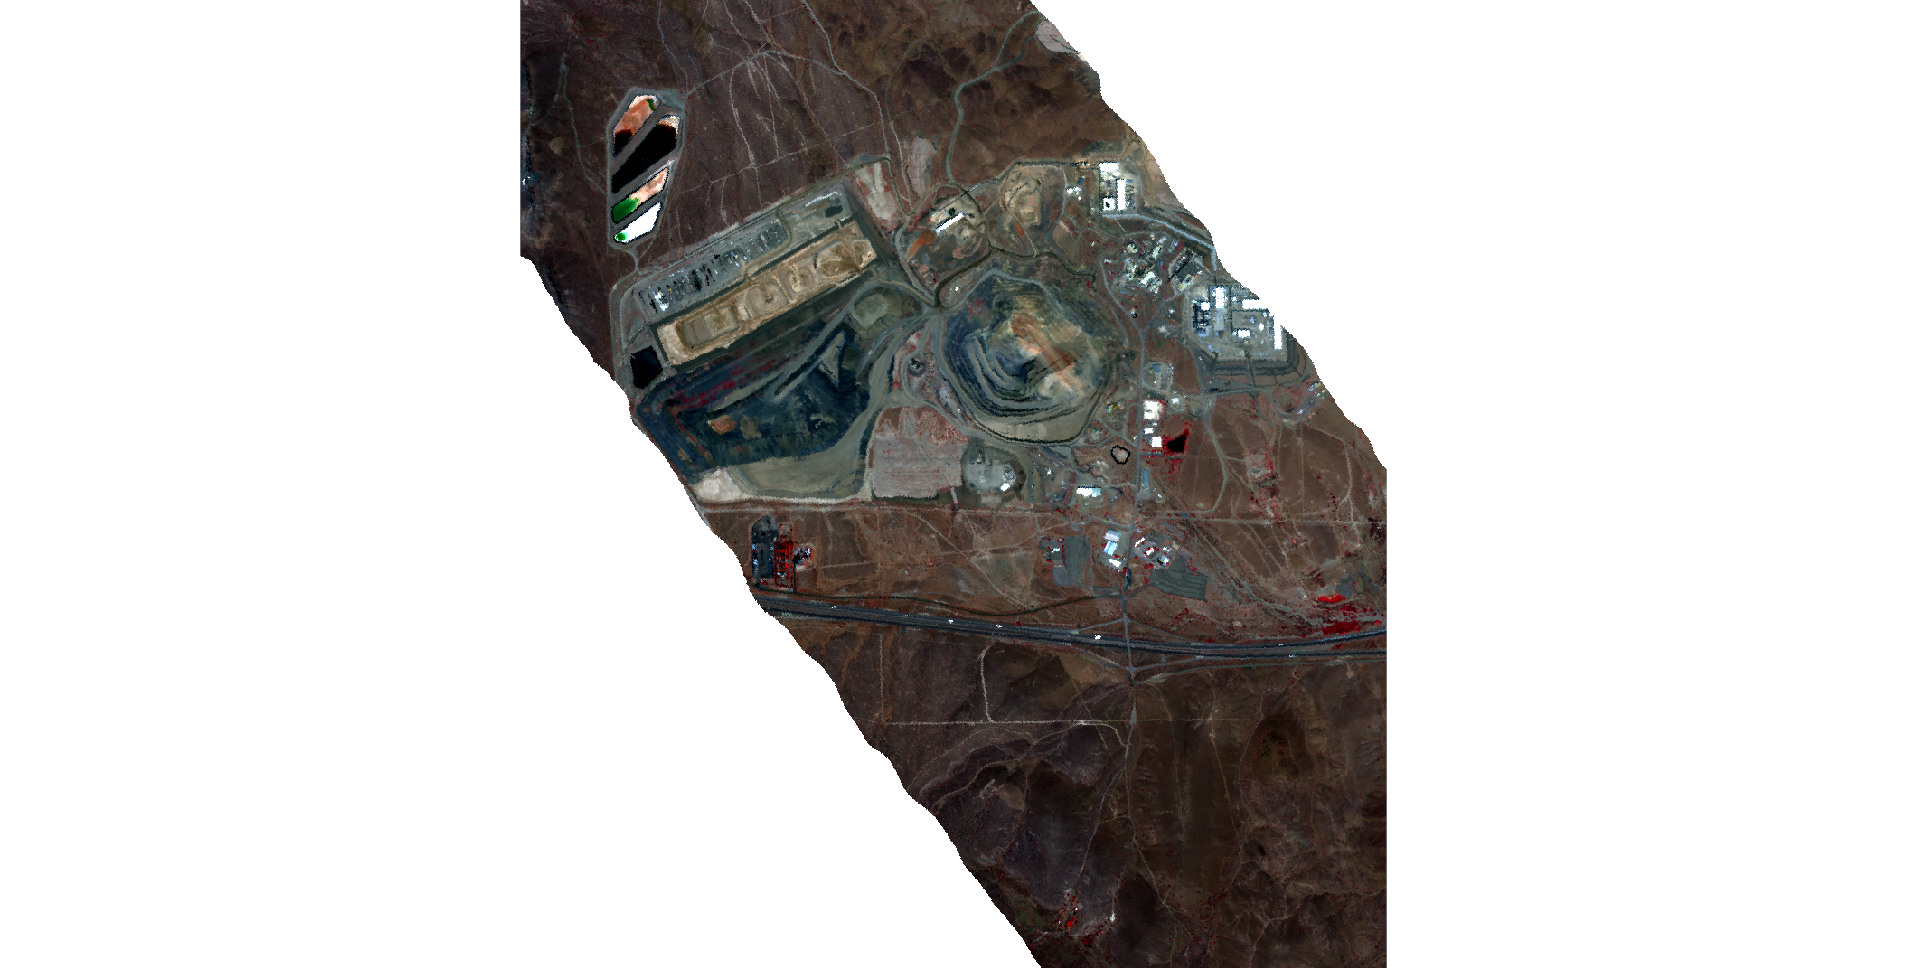
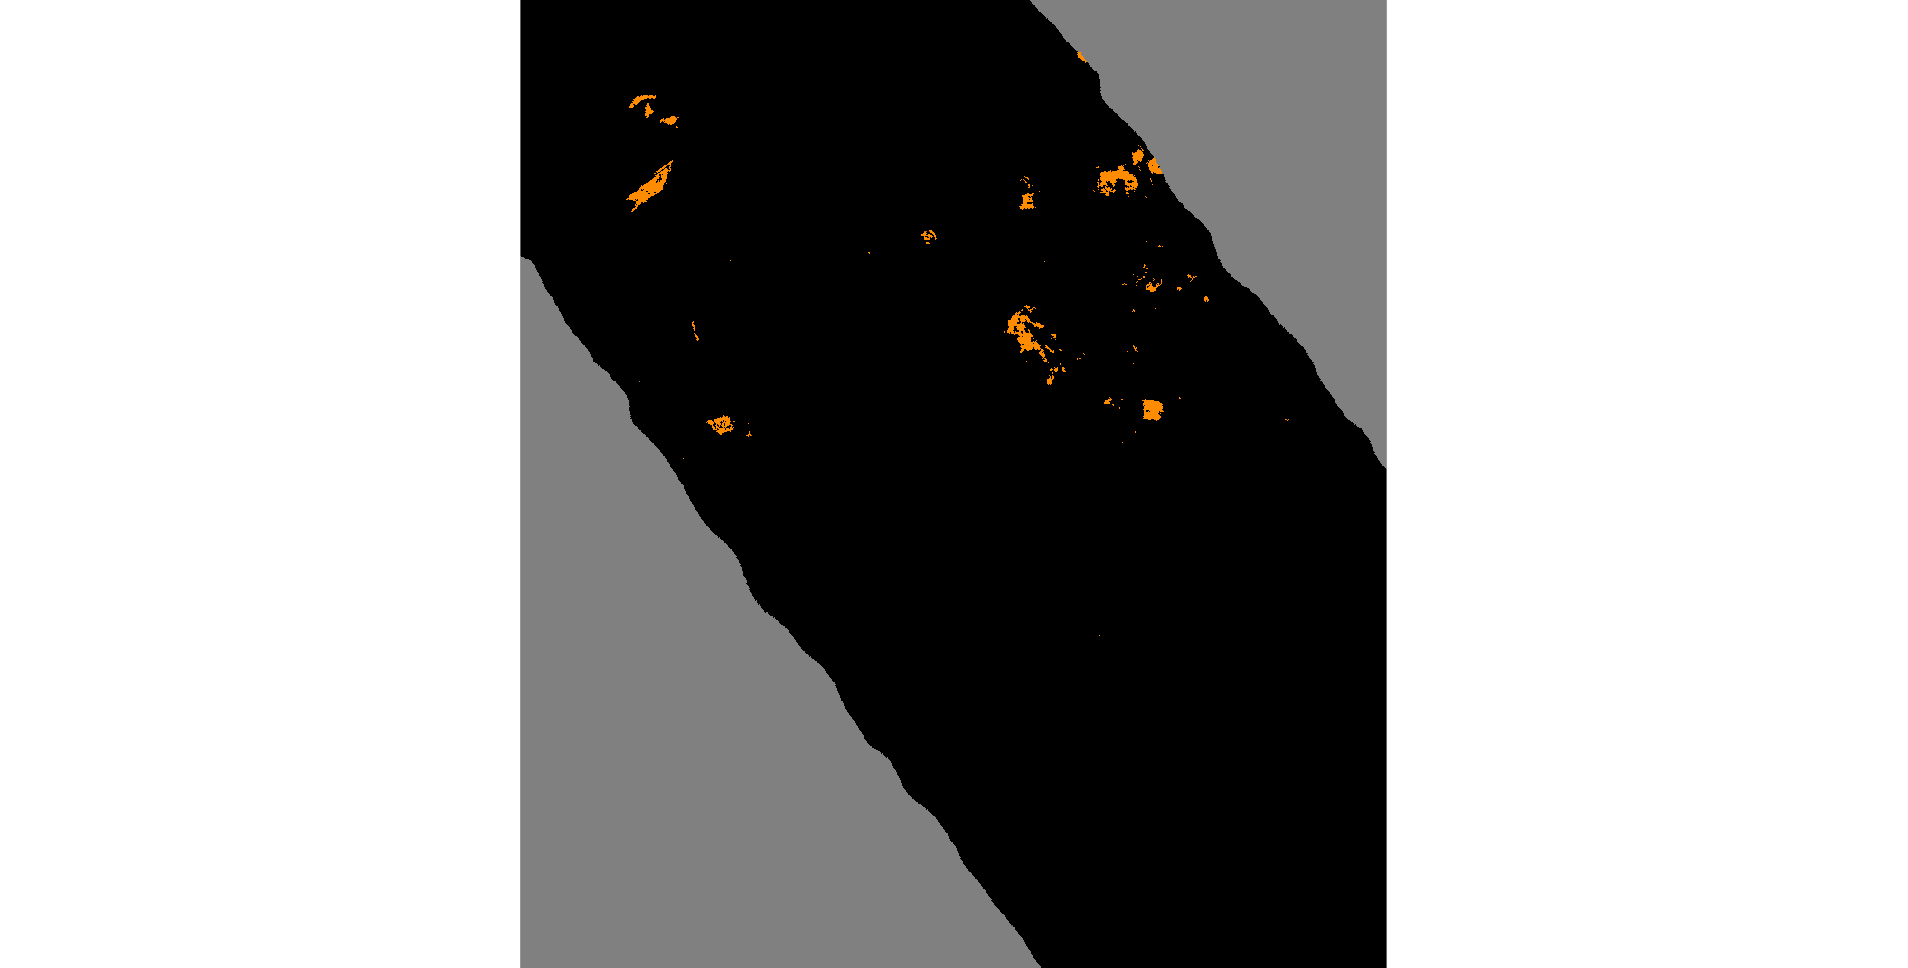
The 4,544 Bastnaesite-classified pixels (orange) are spatially concentrated in two principal zones: (1) the northern active open-pit mine, where the carbonatite ore body is exposed by mining benches; and (2) several smaller clusters in the eastern central area, corresponding to mine waste dumps and stockpiles. The dispersed pattern of orange pixels across terraced mine floors is consistent with heterogeneous exposure of the carbonatite ore and country-rock contacts.
5.2 SAM Rule Image & Raster Color Slice
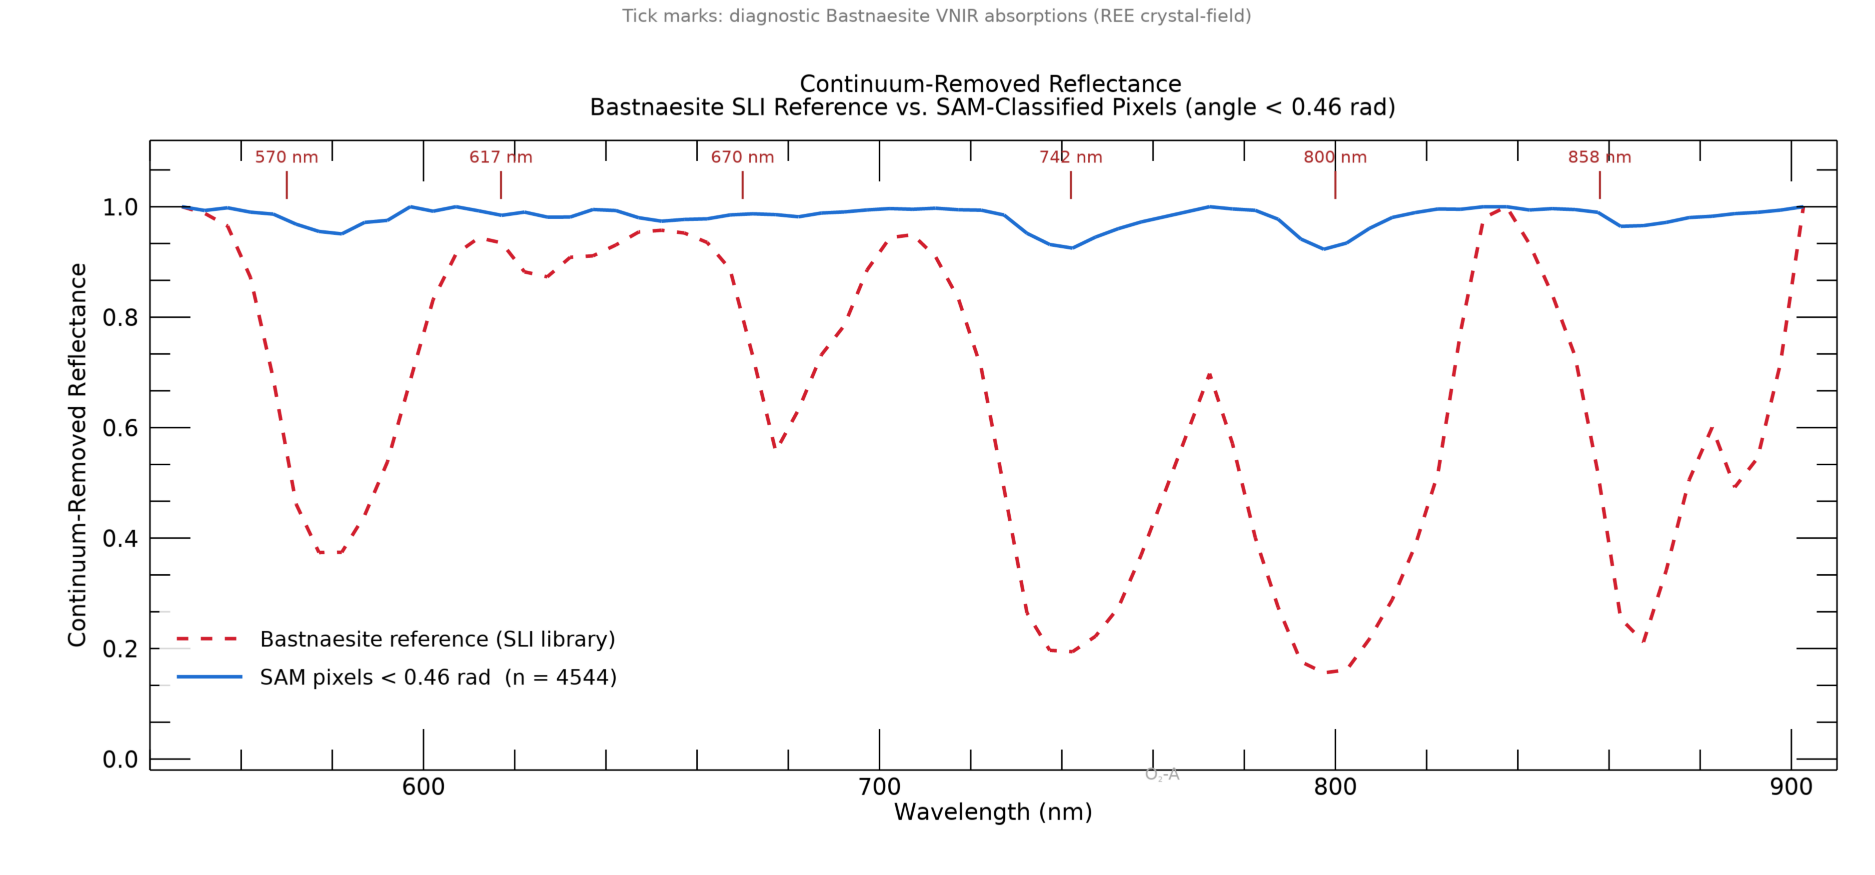
5.3 Spectral Profile Analysis — Continuum-Removed Comparison
5.4 Spectral Angle Distribution Summary
The color slice focusses on the 0.40–0.50 rad window, which encompasses the full valid pixel range of the scene (minimum 0.402 rad). The most populated bins are 0.45–0.49 rad (yellow-green through orange). Pixels with angles above 0.50 rad or below 0.40 rad are rendered black. The natural population break at 0.46 rad was used as the classification threshold, capturing the statistically distinct lower-angle spectral population.
6. Classification Statistics
6.1 Pixel Count Summary
| Class | Color | Pixel Count | % of Valid Pixels | Area (m²) | Area (ha) |
|---|---|---|---|---|---|
| Unclassified | Black (0,0,0) | 696,862 | 99.35% | 8,050,604 | 805.1 |
| Bastnaesite | Dark Orange (255,140,0) | 4,544 | 0.65% | 52,509 | 5.25 |
| Masked Pixels | Gray (128,128,128) | 326,642 | N/A (no-data) | — | — |
| Total (valid) | 701,406 | 100% | 8,103,113 | 810.3 |
6.2 Mean Spectral Reflectance by Class (Selected Bands)
Reflectance values are stored as integer × 10,000 in the image. Divide by 10,000 to obtain fractional reflectance. Bad bands (762, 767 nm) are shown in italics — values are unreliable.
| Band # | Wavelength (nm) | Bastnaesite Mean Refl. (×10⁻⁴) | Bastnaesite Reflectance | Unclassified Mean Refl. (×10⁻⁴) | Unclassified Reflectance | Ratio (Bast / Uncl) |
|---|---|---|---|---|---|---|
| 0 | 547.0 | 2,733 | 0.2733 | 1,727 | 0.1727 | 1.58 |
| 5 | 572.1 | 2,803 | 0.2803 | 1,792 | 0.1792 | 1.56 |
| 10 | 597.1 | 3,057 | 0.3057 | 1,912 | 0.1912 | 1.60 |
| 15 | 622.1 | 3,166 | 0.3166 | 1,908 | 0.1908 | 1.66 |
| 20 | 647.2 | 3,260 | 0.3260 | 1,933 | 0.1933 | 1.69 |
| 25 | 672.2 | 3,410 | 0.3410 | 1,989 | 0.1989 | 1.71 |
| 30 | 697.3 | 3,561 | 0.3561 | 2,080 | 0.2080 | 1.71 |
| 35 | 722.3 | 3,687 | 0.3687 | 2,220 | 0.2220 | 1.66 |
| 40 | 747.4 | 3,627 | 0.3627 | 2,384 | 0.2384 | 1.52 |
| 43 | 762.4 ⚠️ BAD | (3,884) | (0.3884) | (2,403) | (0.2403) | — |
| 44 | 767.4 ⚠️ BAD | (3,947) | (0.3947) | (2,388) | (0.2388) | — |
| 45 | 772.4 | 3,967 | 0.3967 | 2,390 | 0.2390 | 1.66 |
| 50 | 797.5 | 3,766 | 0.3766 | 2,576 | 0.2576 | 1.46 |
| 55 | 822.5 | 4,176 | 0.4176 | 2,539 | 0.2539 | 1.64 |
| 60 | 847.5 | 4,258 | 0.4258 | 2,553 | 0.2553 | 1.67 |
| 65 | 872.6 | 4,202 | 0.4202 | 2,620 | 0.2620 | 1.60 |
| 70 | 897.6 | 4,349 | 0.4349 | 2,622 | 0.2622 | 1.66 |
| 71 | 902.6 | 4,387 | 0.4387 | 2,632 | 0.2632 | 1.67 |
⚠️ Bad band values in parentheses are unreliable due to O₂-A atmospheric absorption and were excluded from the SAM spectral angle computation.
7. Geological & Mineralogical Discussion
7.1 Geology of Mountain Pass
The Mountain Pass deposit is a Proterozoic carbonatite intrusion (~1.4 Ga) emplaced into Proterozoic gneisses and schists of the Mojave Desert terrane. The carbonatite body (locally called the "Sulfide Queen" body) consists dominantly of calcite and dolomite carbonatite with subordinate baritocelestite, barite, and accessory sulfides. The REE mineralization is concentrated in Bastnaesite, a fluoro-carbonate mineral with the formula (Ce,La,Nd)FCO₃. Cerium is the dominant rare earth cation (~49%), followed by lanthanum (~34%) and neodymium (~12%).
Bastnaesite forms yellowish-waxy to brownish hexagonal crystals, commonly intergrown with barite, calcite, and dolomite. The ore body has been mined intermittently since the 1950s. At its peak in the 1980s–1990s, Mountain Pass supplied ~25% of global REE production. After a period of closure, production restarted in 2017 under MP Materials Corp.
7.2 Spectral Properties of Bastnaesite
The spectral signature of Bastnaesite in the VNIR (400–1000 nm) is controlled by two mechanisms:
- Rare earth electronic transitions (f–f transitions): Neodymium³⁺ is the primary absorbing REE cation in the VNIR, producing characteristic absorptions at approximately 577 nm, 740 nm, 800 nm, and 870 nm. These are electric-dipole forbidden f–f transitions that produce relatively narrow, low-contrast absorption bands.
- Carbonate matrix: The fluoro-carbonate structural framework provides a high-reflectance continuum in the VNIR, giving Bastnaesite its characteristic bright yellowish-cream colour. The strong SWIR carbonate combination and overtone bands (at ~2.0, 2.16, 2.33 µm) are not accessible in this AVIRIS-NG sub-image (which covers only 547–903 nm).
The classified Bastnaesite pixels exhibit a steeply rising NIR reflectance (0.2733 at 547 nm → 0.4387 at 903 nm), consistently 1.5–1.7× brighter than the unclassified background terrain. This behaviour is a hallmark of bright carbonate rocks and is consistent with exposures dominated by carbonatite mineralogy (calcite, dolomite, barite, and Bastnaesite).
7.3 Interpretation of Large SAM Angles
The minimum SAM angle across all valid image pixels is 0.402 rad (~23°). This is unusually large compared to standard mineral mapping thresholds of <0.05–0.10 rad for confident pure-mineral identification. The elevated angles are attributable to the following factors:
- Spectral mixing: At 3.4 m GSD, each pixel integrates reflectance from Bastnaesite ore, carbonate gangue (calcite/dolomite/barite), weathered soil, mine infrastructure, and desert pavement. No pixel is spectrally "pure" Bastnaesite.
- Limited spectral range: The 547–903 nm VNIR window captures only the shorter-wavelength Nd³⁺ f–f transitions. The most discriminative carbonate absorption features (SWIR 1.5–2.5 µm) are outside the sensor range. AVIRIS-NG full-range data (covering to 2,500 nm) would dramatically improve classification accuracy.
- Surface weathering: Chemical weathering transforms primary Bastnaesite into secondary phases such as cerianite (CeO₂) and REE-bearing clay minerals, which have different spectral signatures.
- Mine infrastructure: Open-pit mines contain haul roads, conveyors, buildings, and water bodies that contaminate pixel spectra and introduce atypical spectral shapes.
- Shadow effects: Deep mine benches and talus slopes create intra-pixel illumination variation that alters apparent reflectance — a factor SAM is designed to mitigate (angles are illumination-insensitive) but cannot fully eliminate when sub-pixel shading changes the continuum shape.
7.4 Spatial Significance of Classified Pixels
The 4,544 Bastnaesite-classified pixels cover approximately 5.25 hectares (52,509 m²), representing 0.65% of the valid image area. Their spatial distribution is geologically meaningful:
- Northern cluster (active open pit): The densest orange cluster in the northern portion of the scene corresponds to freshly exposed carbonatite faces on the active mine benches — precisely where unweathered Bastnaesite ore would be expected at the surface.
- Eastern clusters (dumps and stockpiles): Smaller clusters in the central-east coincide with mine waste dumps or ore stockpiles, consistent with REE-bearing material being concentrated by mining operations.
- Scattered southern pixels: Isolated orange pixels in the southern half of the scene may represent natural carbonate outcrops of the Clark Mountain Formation limestones, which are spectrally similar (though not geochemically identical) to the Bastnaesite-bearing carbonatite.
7.5 Recommendations for Improved Mapping
- Full AVIRIS-NG spectrum (to 2500 nm): Adding the SWIR spectral range would allow diagnostic carbonate combination bands (2.0, 2.16, 2.33 µm) to be included, dramatically reducing SAM angles and improving discrimination between Bastnaesite, barite, calcite, and dolomite.
- Matched Filter or Linear Spectral Unmixing: These methods can estimate sub-pixel mineral fractions, more appropriate for the spatially mixed environment of an open-pit mine.
- Integration of field spectra: Acquiring in-situ spectra with a field spectrometer (e.g., Spectra Vista HR-1024) from known ore benches would provide site-specific spectral endmembers, reducing the library-to-scene mismatch.
- Multi-date analysis: Change detection between pre- and post-mining flight lines could highlight newly exposed ore faces.
8. Conclusions
- The Spectral Angle Mapper (SAM) was applied to AVIRIS-NG VNIR hyperspectral imagery (547–903 nm, 72 bands) to map Bastnaesite [(Ce,La,Nd)FCO₃] at the Mountain Pass REE deposit, California.
- SAM spectral angles across valid image pixels ranged from 0.402 to 0.798 rad — larger than ideal due to spectral mixing, VNIR-only coverage, and surface weathering. The classification is therefore best interpreted as a relative measure of spectral similarity to Bastnaesite.
- A natural spectral-angle break at 0.46 rad was used as the classification threshold, capturing 4,544 Bastnaesite-similar pixels (≈ 5.25 ha, 0.65% of valid image area).
- Classified pixels are spatially concentrated in the active open-pit mine and associated waste dumps — geologically consistent with the location of the Sulfide Queen carbonatite ore body.
- The Bastnaesite class shows consistently higher NIR reflectance (0.27–0.44) than unclassified terrain (0.17–0.26), consistent with the bright carbonate mineralogy of the carbonatite complex.
- A Raster Color Slice (10 × 0.01 rad intervals, 0.40–0.50 rad, Rainbow palette, black = outside range) provides a continuous visual representation of the spectral-angle gradient, confirming the spatial coherence of the low-angle (most Bastnaesite-like) pixel population.
- Extending the hyperspectral coverage into the SWIR (to 2,500 nm) and incorporating field spectra would substantially improve classification confidence and enable discrimination between co-occurring carbonate minerals (barite, calcite, dolomite).
9. ENVI Modeler Workflow
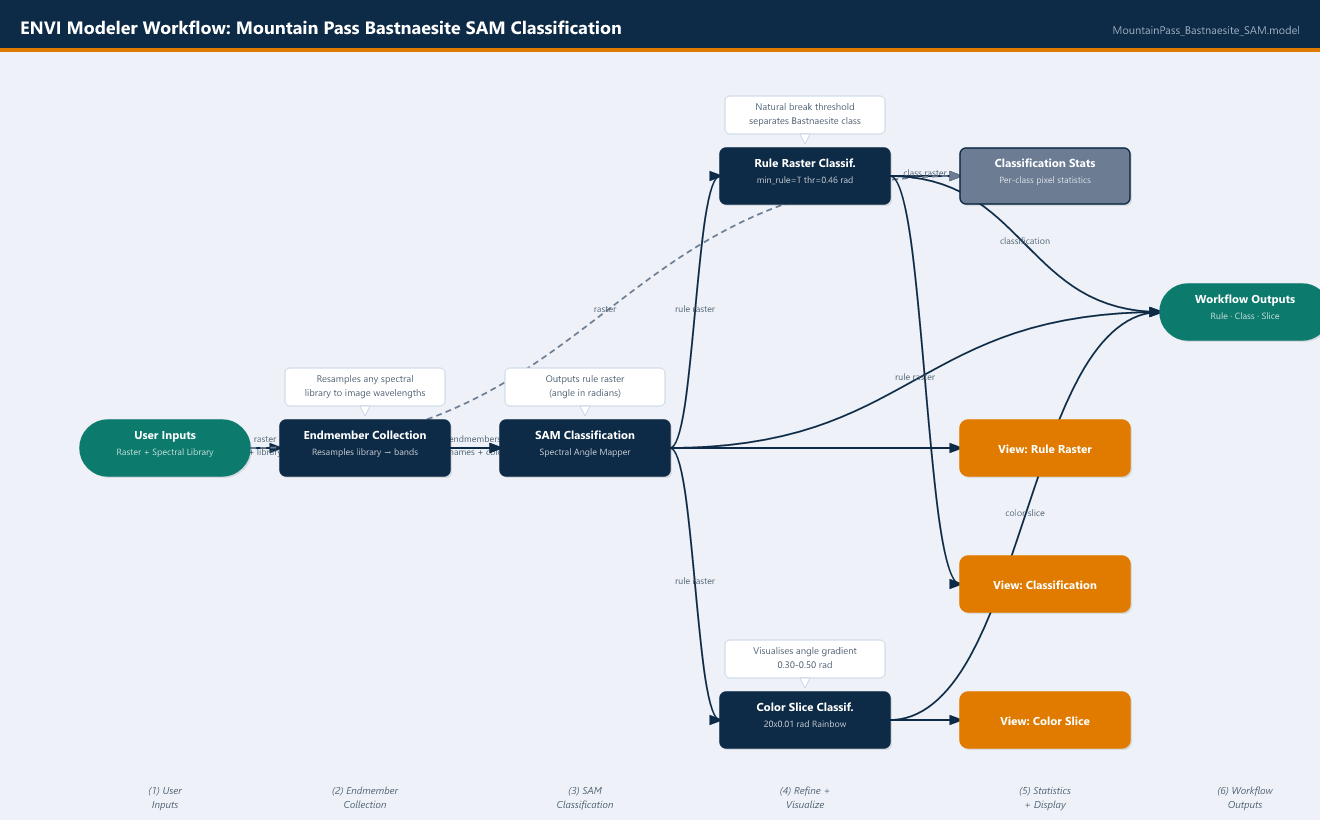
The complete SAM classification pipeline has been encoded as a reusable
ENVI Modeler workflow (MountainPass_Bastnaesite_SAM.model).
This allows the analysis to be repeated on any compatible hyperspectral dataset with
minimal configuration — only two inputs need to be provided at runtime.
Workflow Structure
| Stage | Node | Purpose | Key Parameters |
|---|---|---|---|
| (1) | User Inputs | Runtime inputs provided by the user | Hyperspectral raster + Spectral Library (.sli) |
| (2) | EndmemberCollection | Resamples spectral library to image wavelengths; handles bad-band positions automatically | spectral_library → input_raster |
| (3) | SpectralAngleMapperClassification | Computes per-pixel spectral angle; outputs continuous rule raster (radians) | mean, class_names, class_colors from stage 2; output_rule_raster_uri = "!" (temp) |
| (4a) | RuleRasterClassification | Thresholds the rule raster to produce a discrete classification | minimum_rule = true; threshold = [0.46 rad] |
| (4b) | ColorSliceClassification | Creates a 10-colour gradient map of the rule raster for visual QC | number_of_ranges=10; range_size=0.01; data_minimum=0.40; color_table="Rainbow" (full, black for outside range) |
| (5) | ClassificationStatistics | Computes per-class pixel counts and per-band spectral statistics | input_class_raster from stage 4a; input_raster from stage 1 |
| (6) | Workflow Outputs | Exposes three outputs for downstream use | Rule raster · Classification · Color Slice |
How to Use the Model
-
In the IDL for VS Code extension, open ENVI Modeler and load
MountainPass_Bastnaesite_SAM.modelvia File > Open. -
Click Run. A parameter dialog will appear with two user inputs:
- Hyperspectral Image — select the AVIRIS-NG (or similar) reflectance raster.
- Spectral Library — select an ENVI .sli spectral library containing the mineral reference spectrum.
- The workflow automatically resamples the library to the image bands (via EndmemberCollection), runs SAM, refines with the 0.46 rad threshold, generates the color slice, and displays all three results in ENVI views.
-
To change the classification threshold, open the
RuleRasterClassification node and edit
threshold. To change the mineral target, supply a different spectral library and optionally addspectra_namesto the EndmemberCollection node to select specific spectra from a multi-spectrum library.
Output Files
| File | Description | Format |
|---|---|---|
| SAM_rule_raster.dat / .hdr | SAM spectral angle raster (0.40–0.80 rad, float32) | ENVI BSQ |
| SAM_classification_final.dat / .hdr | Final 3-class classification (Unclassified / Bastnaesite / Masked Pixels) | ENVI Classification |
| SAM_rule_colorslice2.dat / .hdr | Color slice (10 intervals × 0.01 rad, 0.40–0.50 rad, full Rainbow, black = outside range) | ENVI Classification |
| classification_statistics.txt | Per-class pixel counts, per-band min/max/mean/stddev | JSON |
| screenshot_rgb.png | AVIRIS-NG CIR composite (NIR/Red/Green) | PNG |
| screenshot_classification.png | ENVI display screenshot — final classification map | PNG |
| screenshot_rule_raster.png | ENVI display screenshot — SAM rule image | PNG |
| screenshot_colorslice.png | ENVI display screenshot — raster color slice with color legend bar | PNG (2178 × 968 px) |
| spectrum_cr_comparison.png | Continuum-removed spectrum comparison (SLI reference vs. SAM pixels mean) | PNG (1200 × 560 px) |
| screenshot_model.png | ENVI Modeler workflow diagram | PNG |
| MountainPass_Bastnaesite_SAM.model | Reusable ENVI Modeler workflow file | .model |
| MountainPass_SAM_Report.html | This report | HTML |
| MountainPass_SAM_Presentation.pptx | PowerPoint presentation | PPTX |